Methods
Land Cover
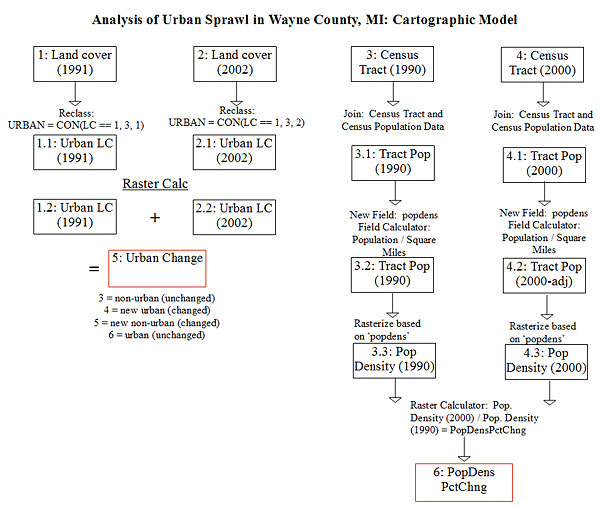
The 1991 and 2002 Land Cover layers for Wayne County, Michigan were analyzed to display the change in urban areas throughout the county. The data layers were obtained from the from the Michigan Geographic Data Library. To begin with, we classified “urban” and “non-urban” areas separately. We attached a value of '3' to urban areas and a value of '1' to non-urban areas for the 1991 Land Cover dataset. For the 2002 Land Cover dataset, we attached a value of '3' to urban areas and a value of '2' to non-urban areas. Using the Raster Calculator we then added these two layers to show the changes in urban and non-urban areas. The map output had four separate classes: a value of '3' for non-urban unchanged areas, a value of '4' for newly developed urban areas, a value of '5' for the new non-urban areas, and a value of '6' for unchanged urban areas.Census
The 1990 and 2000 Census Tract data was analyzed to depict the population density in Wayne County. The census tract shapefiles were acquired from the Michigan Geographic Data Library, and the population data was aquired from the U.S. Census Bureau. The two layers were joined with their correlating census data that contained population information which was in Microsoft Excel format. After the data was joined, a new field was created in the attribute table to calculate population density. We used the field calculator in ArcMap to divide the population of each census tract by the square miles of the corresponding tract. After calculating population density we then rasterized both layers based on the new “popdens” field. Then, using the Raster Calculator, we divided the population density of 2000 by the population density of 1990, which gave us a final raster layer displaying the changes in density throughout Wayne County.

